Lending is one of the oldest functions in finance. A lender lets a borrower turn $1 of collateral into more than $1 worth of financial exposure while charging interest for it. Homeowners do this with a home equity line of credit (HELOC), and options traders do this with margin. The modern economy relies on credit for various financial functions demonstrating a clear product-market fit.
Crypto performs the same function through lending protocols. A user deposits an asset, borrows against it, and pays interest on the loan. Aave, the leading lending venue, accepts USDC, EUR, and gold-pegged assets as collateral and intermediates ~$10B in active loans. The base primitive supports cash-and-carry trades and long and short positions, and it has grown into curated vault products through protocols like Morpho which recently integrated with Coinbase. In structure these venues now resemble global FX markets.
The industry is evolving and the competitive landscape is following suit. Specifically, the interest rate a borrower pays has converged into a narrow band across every major protocol, and the share of that interest each protocol keeps is converging with it. When both the price and the margin flatten this way, the only variable left to move is scale. The business becomes a contest for the largest loan book, and the question worth answering is which venue wins that contest, and whether its market price already reflects the answer.
Key Takeaways
- Lending is a power law category. Aave holds 43% of DeFi active loans and the top three venues hold 66% of them.
- Borrow yields have converged into a 3.5–5.5% band across all eight major venues, and the take rate each protocol keeps is pinned. With price and capture both becoming static, the size of the loan book is the only active lever left.
- The take rate sorts venues into four buckets: Aave and Kamino hold a defensible premium, Aave on brand and Kamino as Solana’s dominant venue. SparkLend, Fluid and Euler lean on ancillary lines like liquidity provision and licensing. Morpho sets take to zero to buy scale. Compound and Jupiter Lend lean entirely on the reserve factor, the least diversified take and the one most exposed as pricing power erodes.
- Once token incentives are counted, only Aave, SparkLend, Fluid and Kamino clear their cost of capital. Morpho sits deepest below the line by choice, paying roughly $17M a year in emissions on a zero take.
How we got here
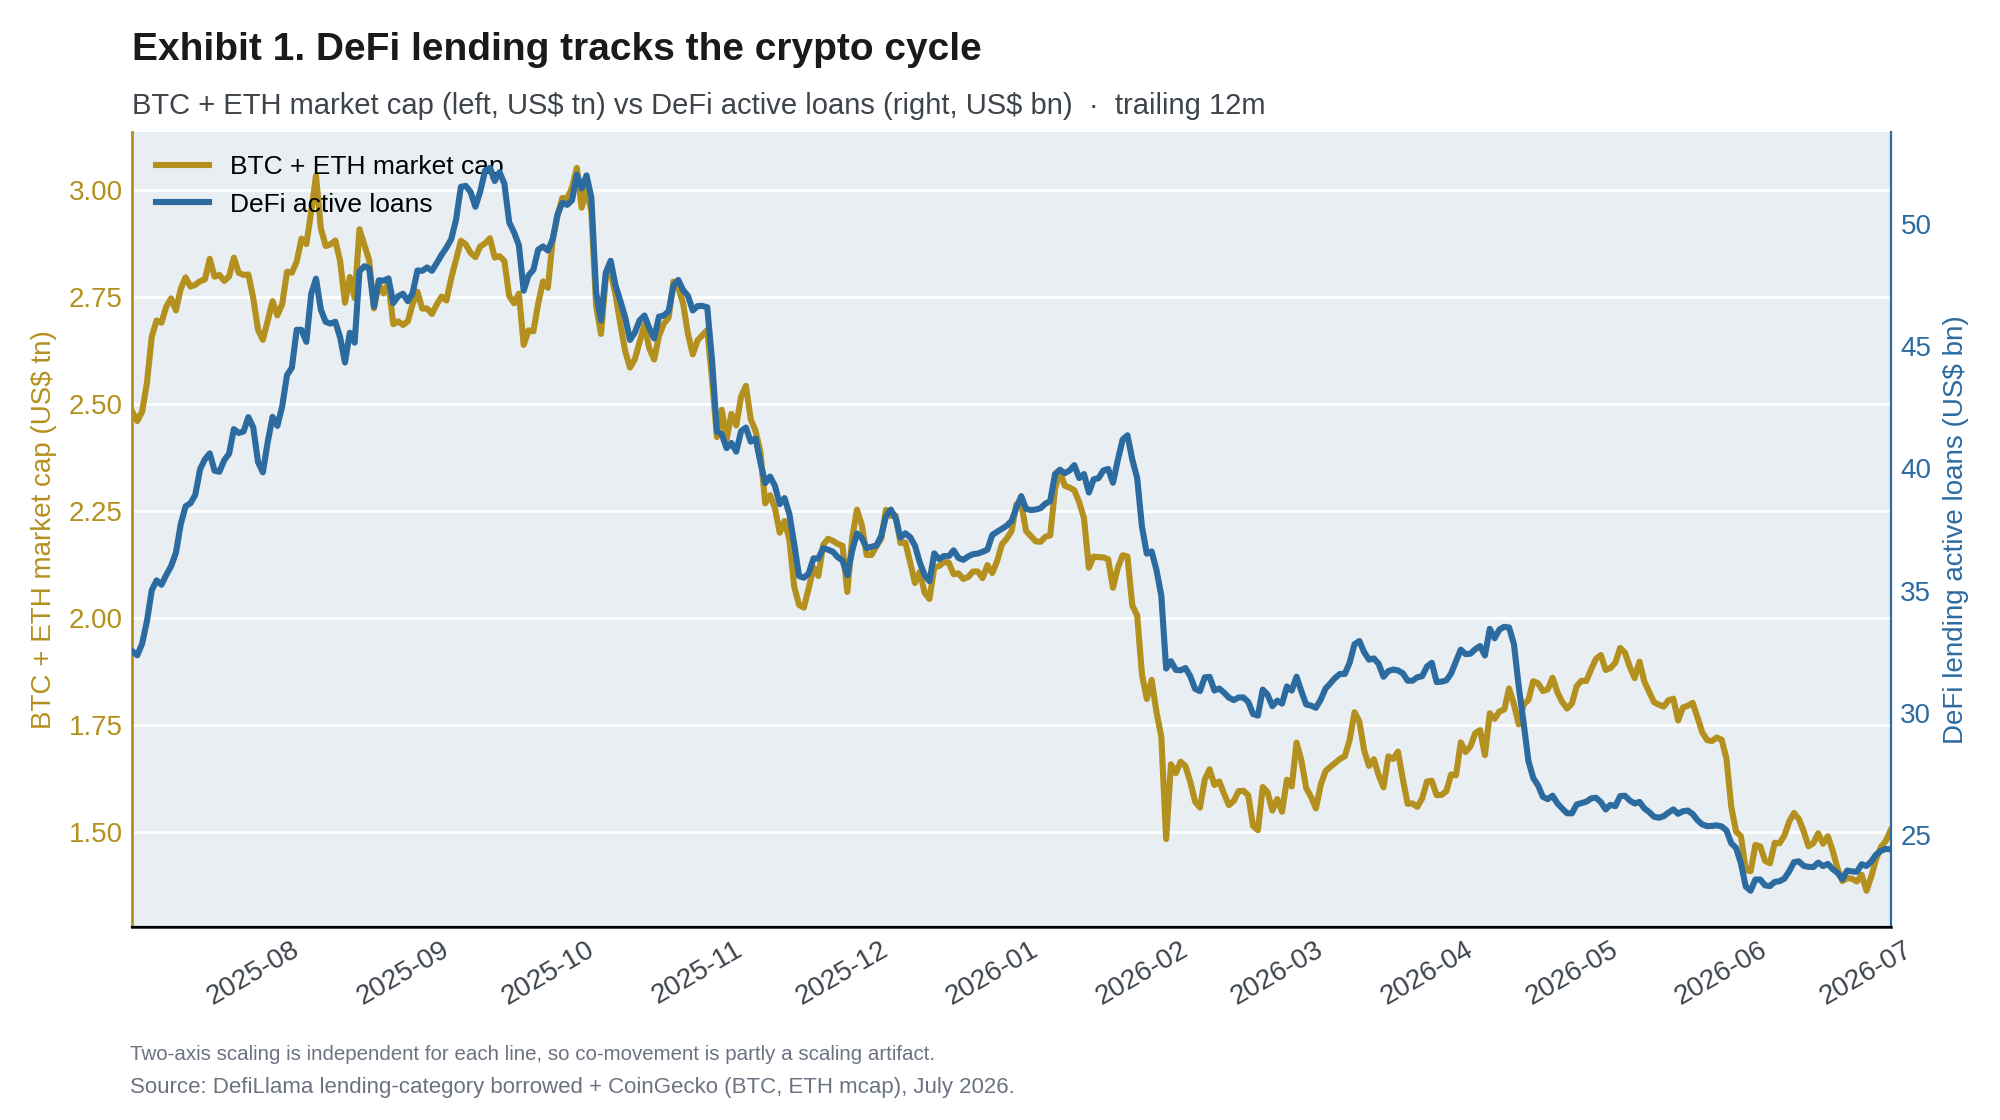
Total active loans peaked at $52.3B in September 2025 at the height of the bull market but loans have since dropped to $24.4B as of July 2026. Since the majority of collateral on lending platforms are crypto-native assets, market prices and platform inventory are self-referential.
BTC and ETH (incl. LSTs and BTC wrappers) make up 76% of net total value locked (TVL) across Aave (77%), Morpho (67%), and SparkLend (87%).
Source: DefiLlama + CoinGecko
Leverage often rises after spot peaks, as shown in September 2025. Following a peak, people borrow to re-enter, and inversely when spot prices fall loans decrease due to de-risking (repaid loans) and liquidations.
In its current state, lending is a power law category. Aave holds 43% of DeFi active loans, and the top three protocols hold 66%.
| Protocol | Active Loans | Avg Loans (TTM) | % of Category (TVL) | Revenue TTM | Earnings TTM |
|---|---|---|---|---|---|
| Aave | $10.50B | $20.23B | 34.3% | $927M | $122.3M |
| Morpho | $3.69B | $3.55B | 18.2% | $209M | $0 |
| SparkLend* | $1.81B | $1.71B | 9.5% | $211M | $24.9M |
| Kamino | $952M | $1.32B | 2.7% | $80M | $12.1M |
| Jupiter Lend | $859M | $637M** | 2.5% | $26M | $1.4M |
| Fluid* | $739M | $1.24B | 1.6% | $74M | $12.6M |
| Euler | $603M | $1.08B | 0.8% | $67M | $3.8M |
| Compound | $569M | $848M | 3.2% | $38M | $2.4M |
* Revenue/Earnings TTM use the whole-protocol endpoint (Spark, Fluid — includes non-lending arms); Active Loans, TVL and Share are the lending market only. ** Jupiter Lend is lend-only; the TTM loan-book average covers ~323 days (launched Aug 2025), not a full year. % of Category (TVL) = each protocol’s TVL ÷ whole DeFi Lending-category TVL ($39.2B), where these eight = 73% of category TVL.
Source: DefiLlama
While the lending category is consolidating, the business of lending dollars against crypto collateral is becoming commoditized. With more competition, best practices diffuse across venues. And because the smart contracts are open source, rivals fork the winning design outright, making convergence mechanical.
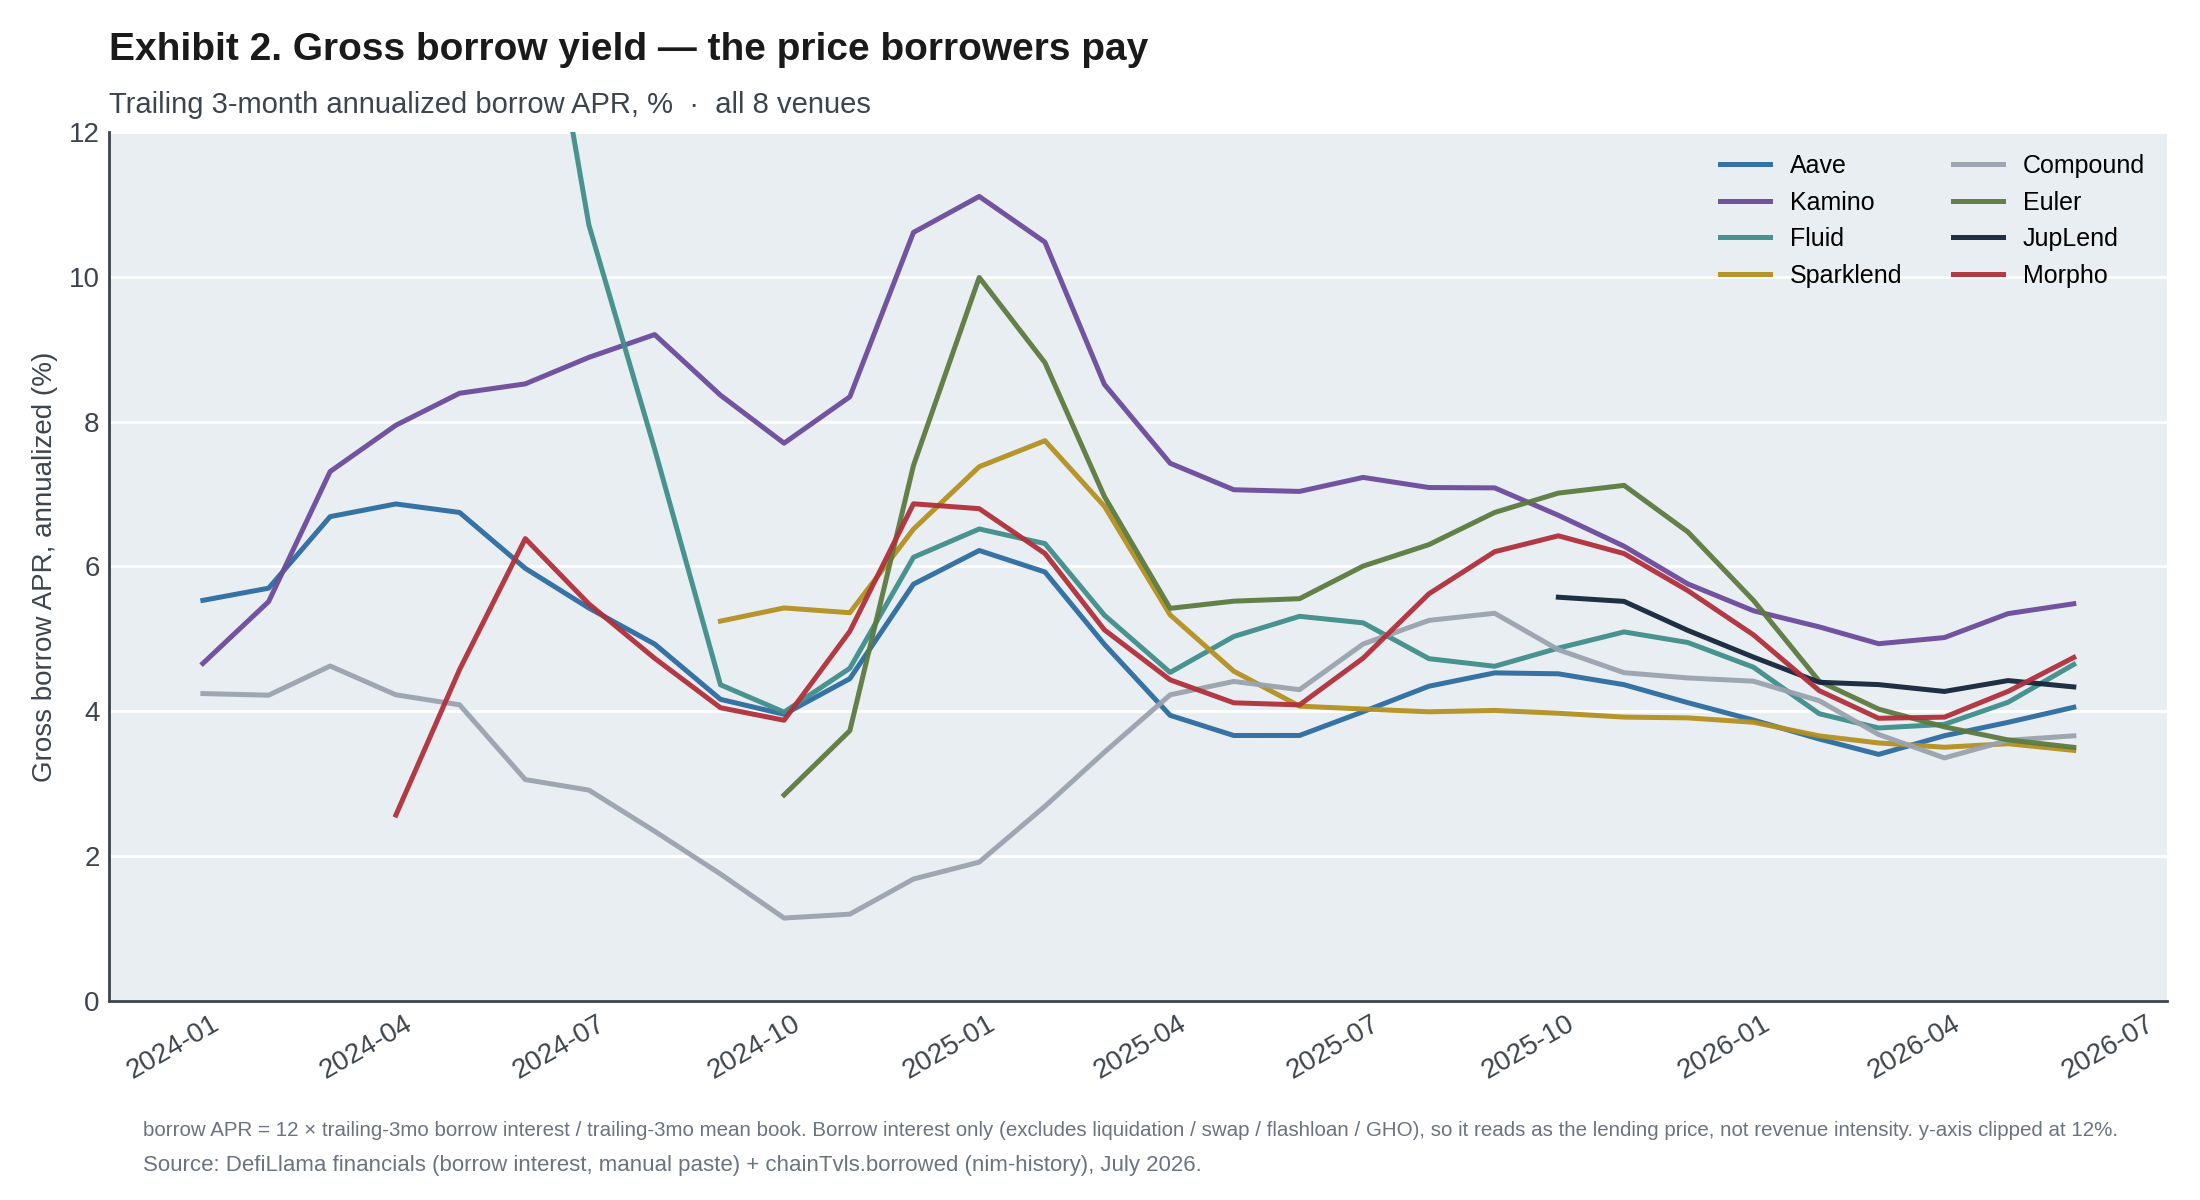
Gross borrow yield is the interest (price) borrowers pay per dollar of active loans. It rose with rates into early 2025, then converged. By mid-2026 all eight venues sat in a tight 3.5% to 5.5% band.
Source: DefiLlama
Since capital is fungible, it can chase the best rates instantly. That means borrow-yield convergence is the base case. As pricing power erodes, venues defend their take rates in two ways: reducing costs and adding new business lines to increase earnings.
A lending protocol’s revenue is the interest borrowers pay. That interest is split according to a Reserve Factor, which sets the protocol’s share (its earnings). The remaining interest goes to depositors as supply yield. Reserve factor is the primary rate that influences costs and margin. Venues must balance the reserve factor to incentivize depositors while maintaining sizable margins. Secondary revenue comes from liquidation penalties, flash loans, and licensing deals.
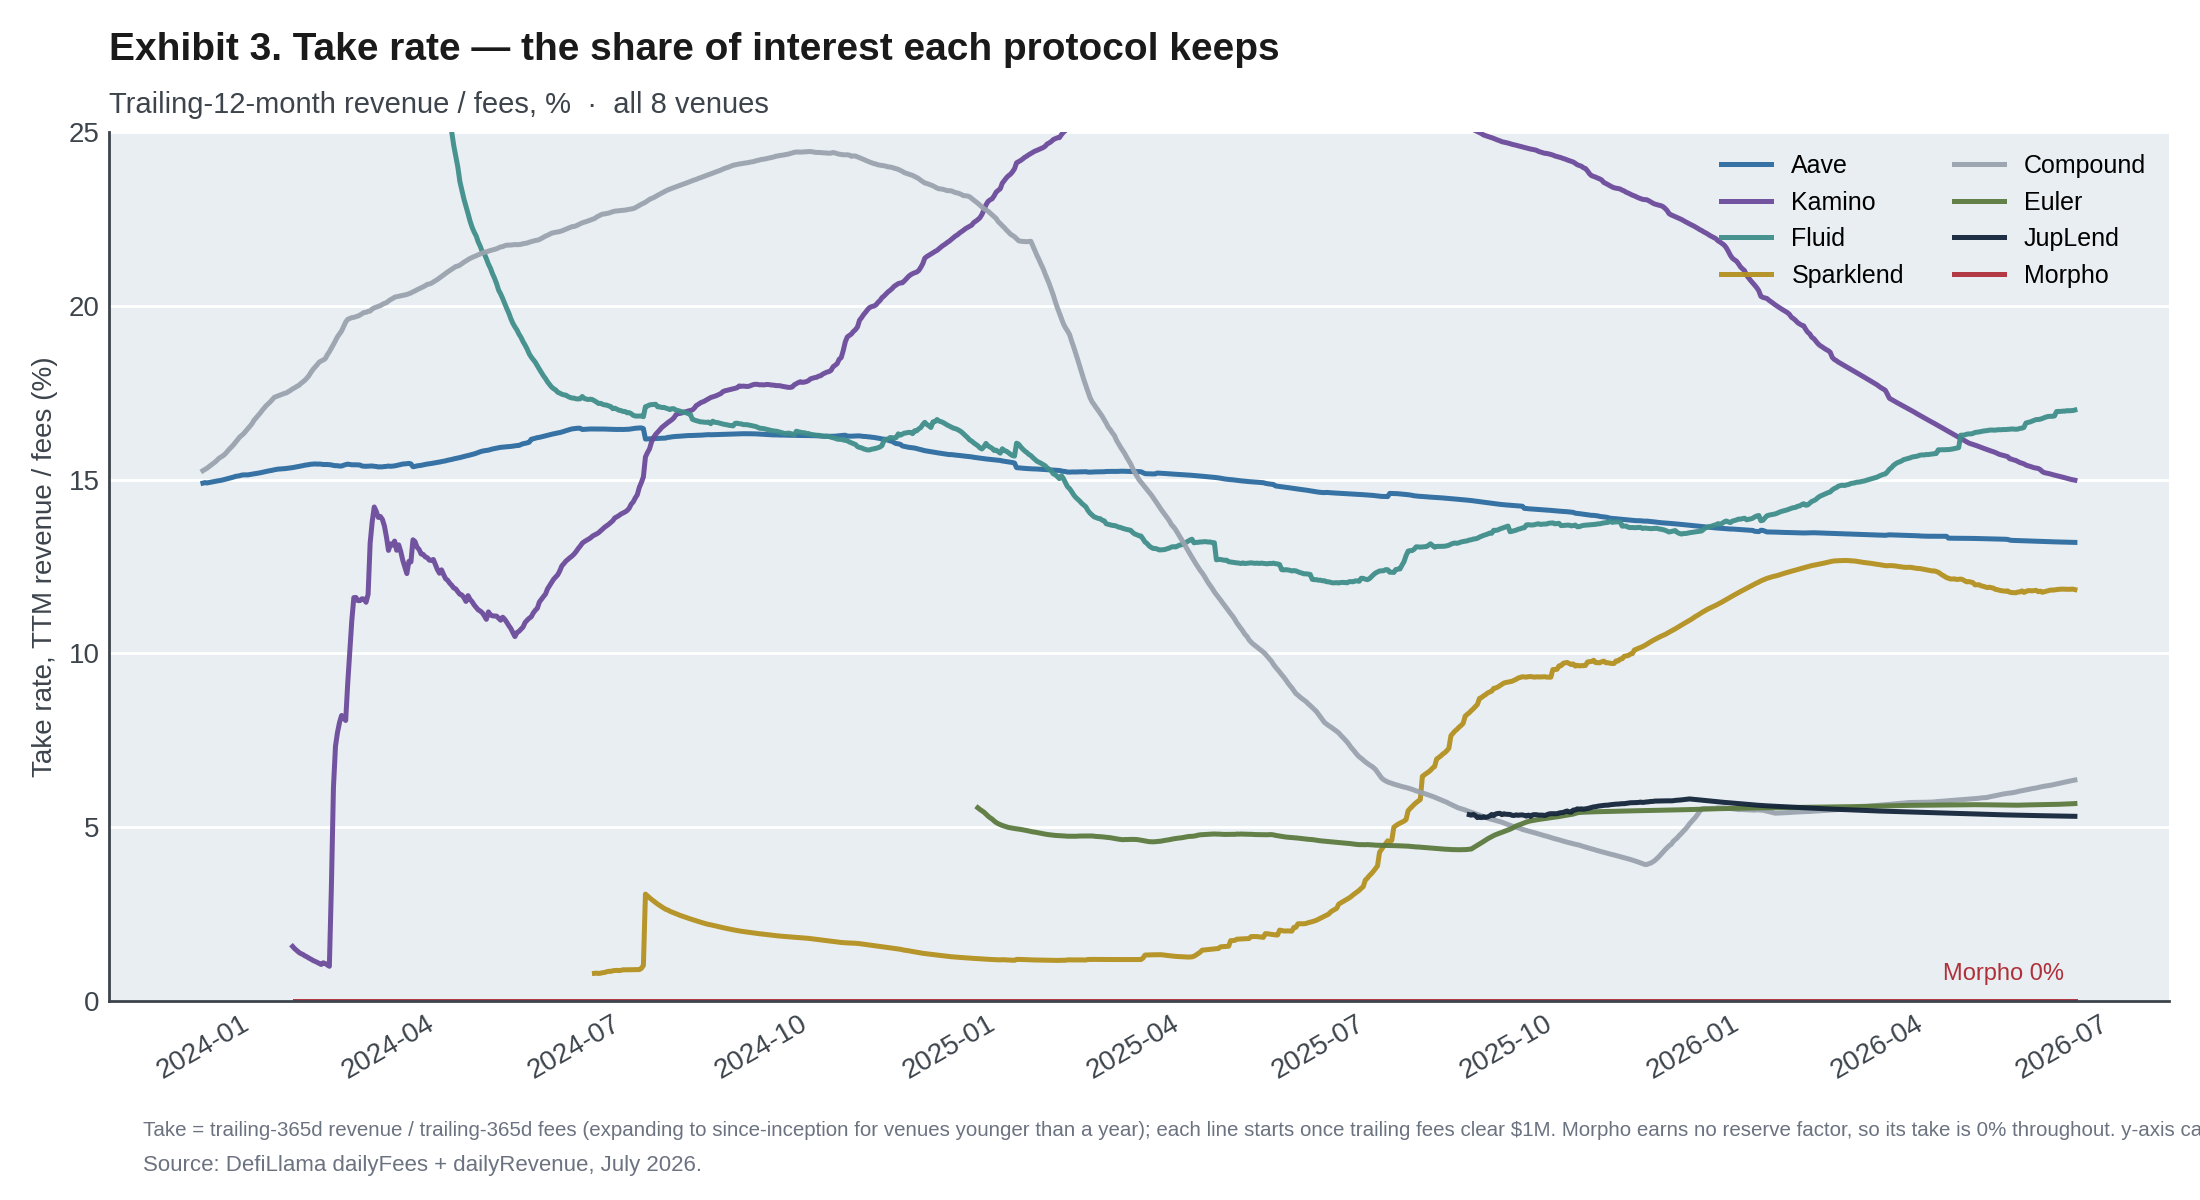
Together, the reserve factor, and secondary sources control the take rate (earnings/revenue). Over the past 12 months, reserve factors have tightened, causing Take Rates to converge into a band.
Defensibility of take is inversely proportional to how much of it comes from the reserve factor. Protocols with high reserve fees, like Kamino are reverting back to the mean. Meanwhile, venues like SparkLend, Fluid, and Euler are relying on additional sources like liquidations, liquidity provision and licensing agreements to reinforce take rates in anticipation of future reserve fee compression.
| Protocol | Take Rate (Earn / Rev) | Reserve factor fee | Earnings margin (Earn / Avg Loans) | % of earnings from borrow interest | % of earnings from non-interest |
|---|---|---|---|---|---|
| Aave | 13.2% | 12.4% | 0.60% | 84% | 16% |
| Morpho | 0% | 0% | 0.00% | — | — |
| SparkLend* | 11.8% | 7.2% | 1.46% | 19% | 81% |
| Kamino | 15.0% | 14.8% | 0.91% | 87% | 13% |
| Jupiter Lend | 5.3% | 5.3% | 0.23% | 100% | 0% |
| Euler | 5.7% | 0.0% | 0.35% | 0% | 100% (a separate skim) |
| Fluid* | 17.0% | 12.0% | 1.02% | 54% | 46% |
| Compound | 6.3% | 6.3% | 0.28% | 100% | 0% |
* Whole-entity basis: SparkLend and Fluid use whole-protocol revenue for take, margin, and the interest split (Spark’s liquidity-layer yields; Fluid’s DEX and lite vaults), while the reserve factor stays lending-only. Same basis as the first table.
Source: DefiLlama
Lifting take means raising the reserve factor, which taxes suppliers and bleeds the scale a venue is chasing, or building secondary lines like liquidations and licensing, which are slow and not open to everyone.
As a result, protocols are bucketed by where the capture comes from and whether it holds in a commoditizing market, which reveals 4 groups:
- Defensible Premium - a high take that holds because suppliers have no better home, whether from brand and liquidity depth (Aave) or from being the dominant venue on its chain (Kamino). Take is high and stable
- Ancillary take - High take rate that comes from lines that don’t tax suppliers, including liquidations, flashloans, and licensing. Take rises without touching the reserve factor, so it doesn’t impede scale (SparkLend, Fluid, and Euler)
- Capture sacrificed for scale - Take set to zero on purpose (Morpho)
- Reserve-factor-dependent take - A low take drawn almost entirely from the reserve factor, with no defensible premium or secondary lines to lean on. It is the least diversified take and the baseline the sector drifts toward as pricing power erodes (Compound and Jupiter Lend)
Source: DefiLlama
Kamino’s take reverts to a higher floor because Solana has fewer lending protocols than EVM. The only other major competitor on Solana, Jupiter Lend, is the venue that caps it.
Morpho, the second largest venue on EVM chains, has conceded the price war, reducing take to 0% to drain market share from competitors. Euler is considering following suit, setting take to 0% in a proposed governance discussion.
Since price (gross borrow yields) is being largely competed away and capture (take rates) is converging to a banded range, earnings growth shows up in the only active lever left: scale (active loans).
Earnings expressed as a formula is: Earnings = Scale × Price × Capture
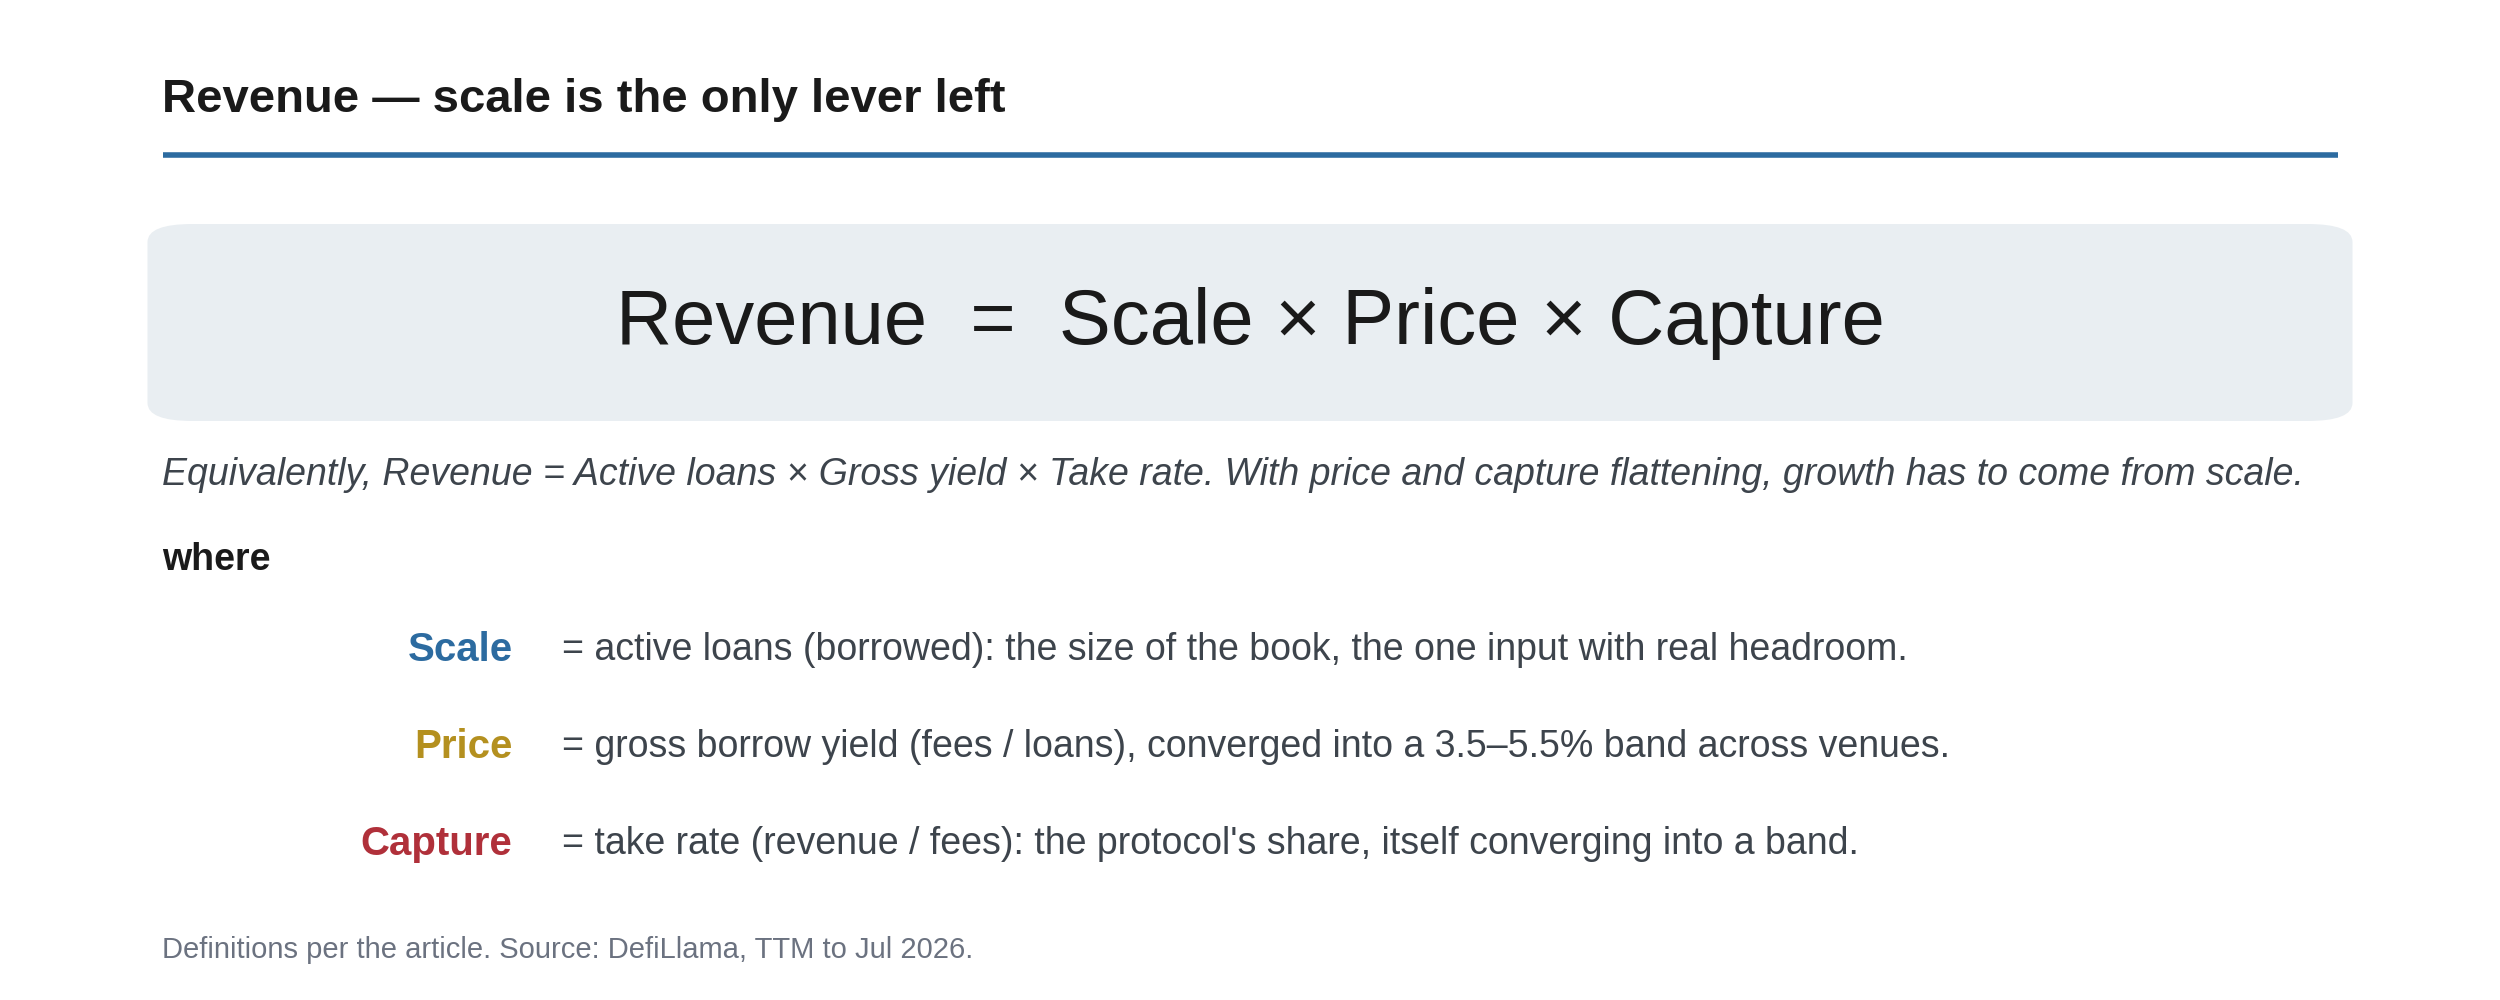
The market is essentially betting on whose loan book can compound over time and expand beyond the cyclicality of crypto. Scale is the active lever and distribution is the moat. And projects are approaching the scale issue with drastically different strategies.
Where we are today: integrated vs. unbundled
Most lending protocols are moving on from monolithic architecture and adopting modular designs where markets are isolated by asset and risk. However, even as architecture converges, the market is still separated by two competing business models: integrated, and unbundled.
| Integrated (protocol curates) | Unbundled (third parties curate) | |
|---|---|---|
| Monolithic | Aave v3, Compound, Fluid, SparkLend | — |
| Modular | Aave v4, Jupiter Lend | Morpho, Euler v2, Kamino |
Source: protocol docs
On one hand, Aave is modular but integrated. It recently launched modular markets with v4 in late March 2026. In v4, hubs (markets) hold liquidity which seed multiple spokes (vaults). Although Aave v4 is modular in architecture it remains an integrated stack: the protocol still approves and vets every spoke. The protocol is the curator. It sets every LTV, oracle, and listing, bears the risk decision, and takes the reserve factor on borrow interest plus secondary skims (liquidations, flash loans, licensing).
On the other hand, protocols like Morpho, Kamino, and Euler are modular but unbundled. These protocols maintain the base lending primitive, but hand over risk and curation to third parties. This surface area creates a market for traditional asset managers and DeFi native risk curators to productize vaults and earn from management fees. Curators select collateral, liquidity depth, and liquidation logic.
The key difference between integrated and unbundled business models is who manages the risk and who sets the spread/split.
Integrated protocols capture the full spread at the cost of having to build demand and curation themselves, while unbundled protocols outsource components at the cost of pricing power. For instance, Aave splits its revenue between two parties: depositors and the protocol. The split is set unilaterally by moving the reserve factor.
However, in the case of Morpho, third party claimants supply things Morpho doesn’t own. Curators supply risk management and distribution is supplied by partners like Coinbase, which supply borrowers. As a result, the share must be split between four parties: depositors, curators, distribution, and eventually the protocol. Simply put, an unbundled protocol would have to garner ~2-3x more partnerships than an integrated protocol like Aave, to make the same impact on its earnings.
An integrated protocol like Aave can set its own price at the cost of having to build demand and curation itself, while an unbundled protocol can grow fast through third-party curators and integrations, but its economics must be negotiated.
Beyond economics, the two models contain risk differently. Even in modular form, an integrated protocol still pools liquidity through shared hubs, so a bad market in one place can draw down the wider book. An unbundled protocol isolates each vault, so a curator’s mistake is capped at that vault and does not spread across the protocol.
They also differ in who eats the loss once it lands. Aave absorbs shortfall through a shared backstop (the Umbrella safety module), which pays out when a market goes bad and spreads the damage across the system. Morpho runs no such backstop, so the loss sits with the depositors of the vault that took it.
The Lending Profit Pool
Morpho has set its take to zero and passes all yield to vault curators and depositors in an effort to acquire scale. By doing so, it puts off negotiations for a later time. This is a strategic move to penetrate the market, and attack the market leaders.
Calculating the Economic profit (EP) of each venue shows us where the real profit in lending actually sits. Economic profit (EP) is what a venue earns above its cost of capital. Specifically, the EP measures the profit the platform earned after subtracting the minimum profit that capital could have earned elsewhere.
EP = earnings − token incentives − r × capital-at-risk
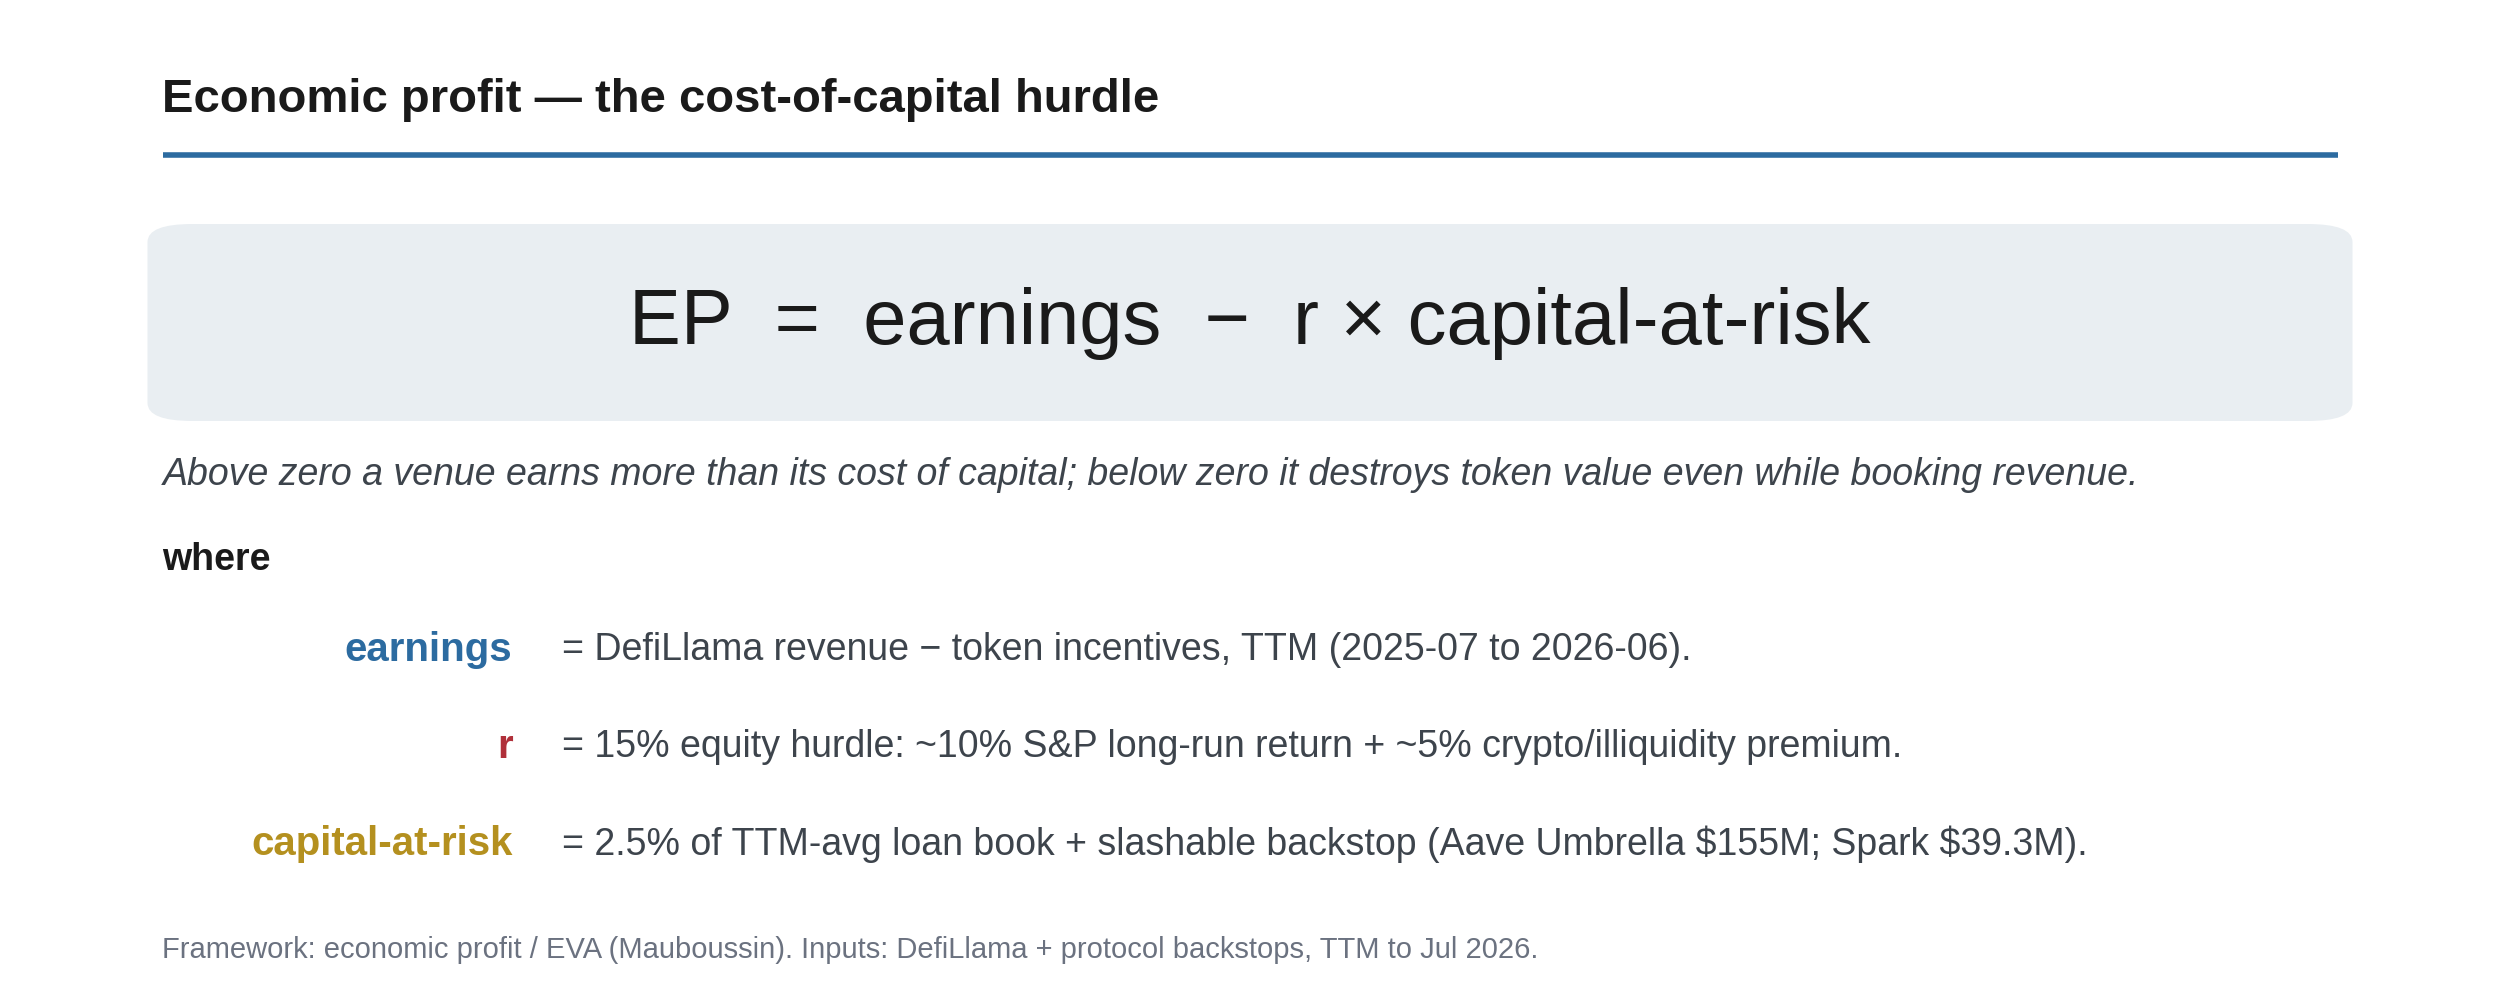
| Protocol | Earnings | Token incentives† | Capital-at-risk | r × capital | EP | Verdict |
|---|---|---|---|---|---|---|
| Aave | $122.3M | $0.7M | $660.8M | $99.1M | +$22.5M | pass |
| SparkLend | $24.9M | $0 | $82.1M | $12.3M | +$12.6M | pass* |
| Kamino | $12.1M | $0 | $33.1M | $5.0M | +$7.1M | pass |
| Fluid | $12.6M | $7.9M | $30.9M | $4.6M | +$0.1M | pass |
| Compound | $2.4M | $0 | $21.2M | $3.2M | −$0.8M | fail |
| Jupiter Lend | $1.4M | $0 | $15.9M | $2.4M | −$1.0M | fail |
| Euler | $3.8M | $4.9M | $27.1M | $4.1M | −$5.2M | fail |
| Morpho | $0.0M | $17.0M | $88.8M | $13.3M | −$30.3M | fail |
* Spark’s pass leans on whole-Spark earnings. Most of it is the Spark Liquidity Layer, not the loan book, and the TTM revenue is a fading peak. See below.
Source: DefiLlama + framework (assumptions above)
Once emissions are counted, four venues still earn above their cost of capital: Aave, SparkLend, Kamino, and Fluid. Aave’s $122.3M take is the largest in the set and drives the most economic profit at +$22.5M. This also makes it the biggest target for modularized lending protocols to siphon scale.
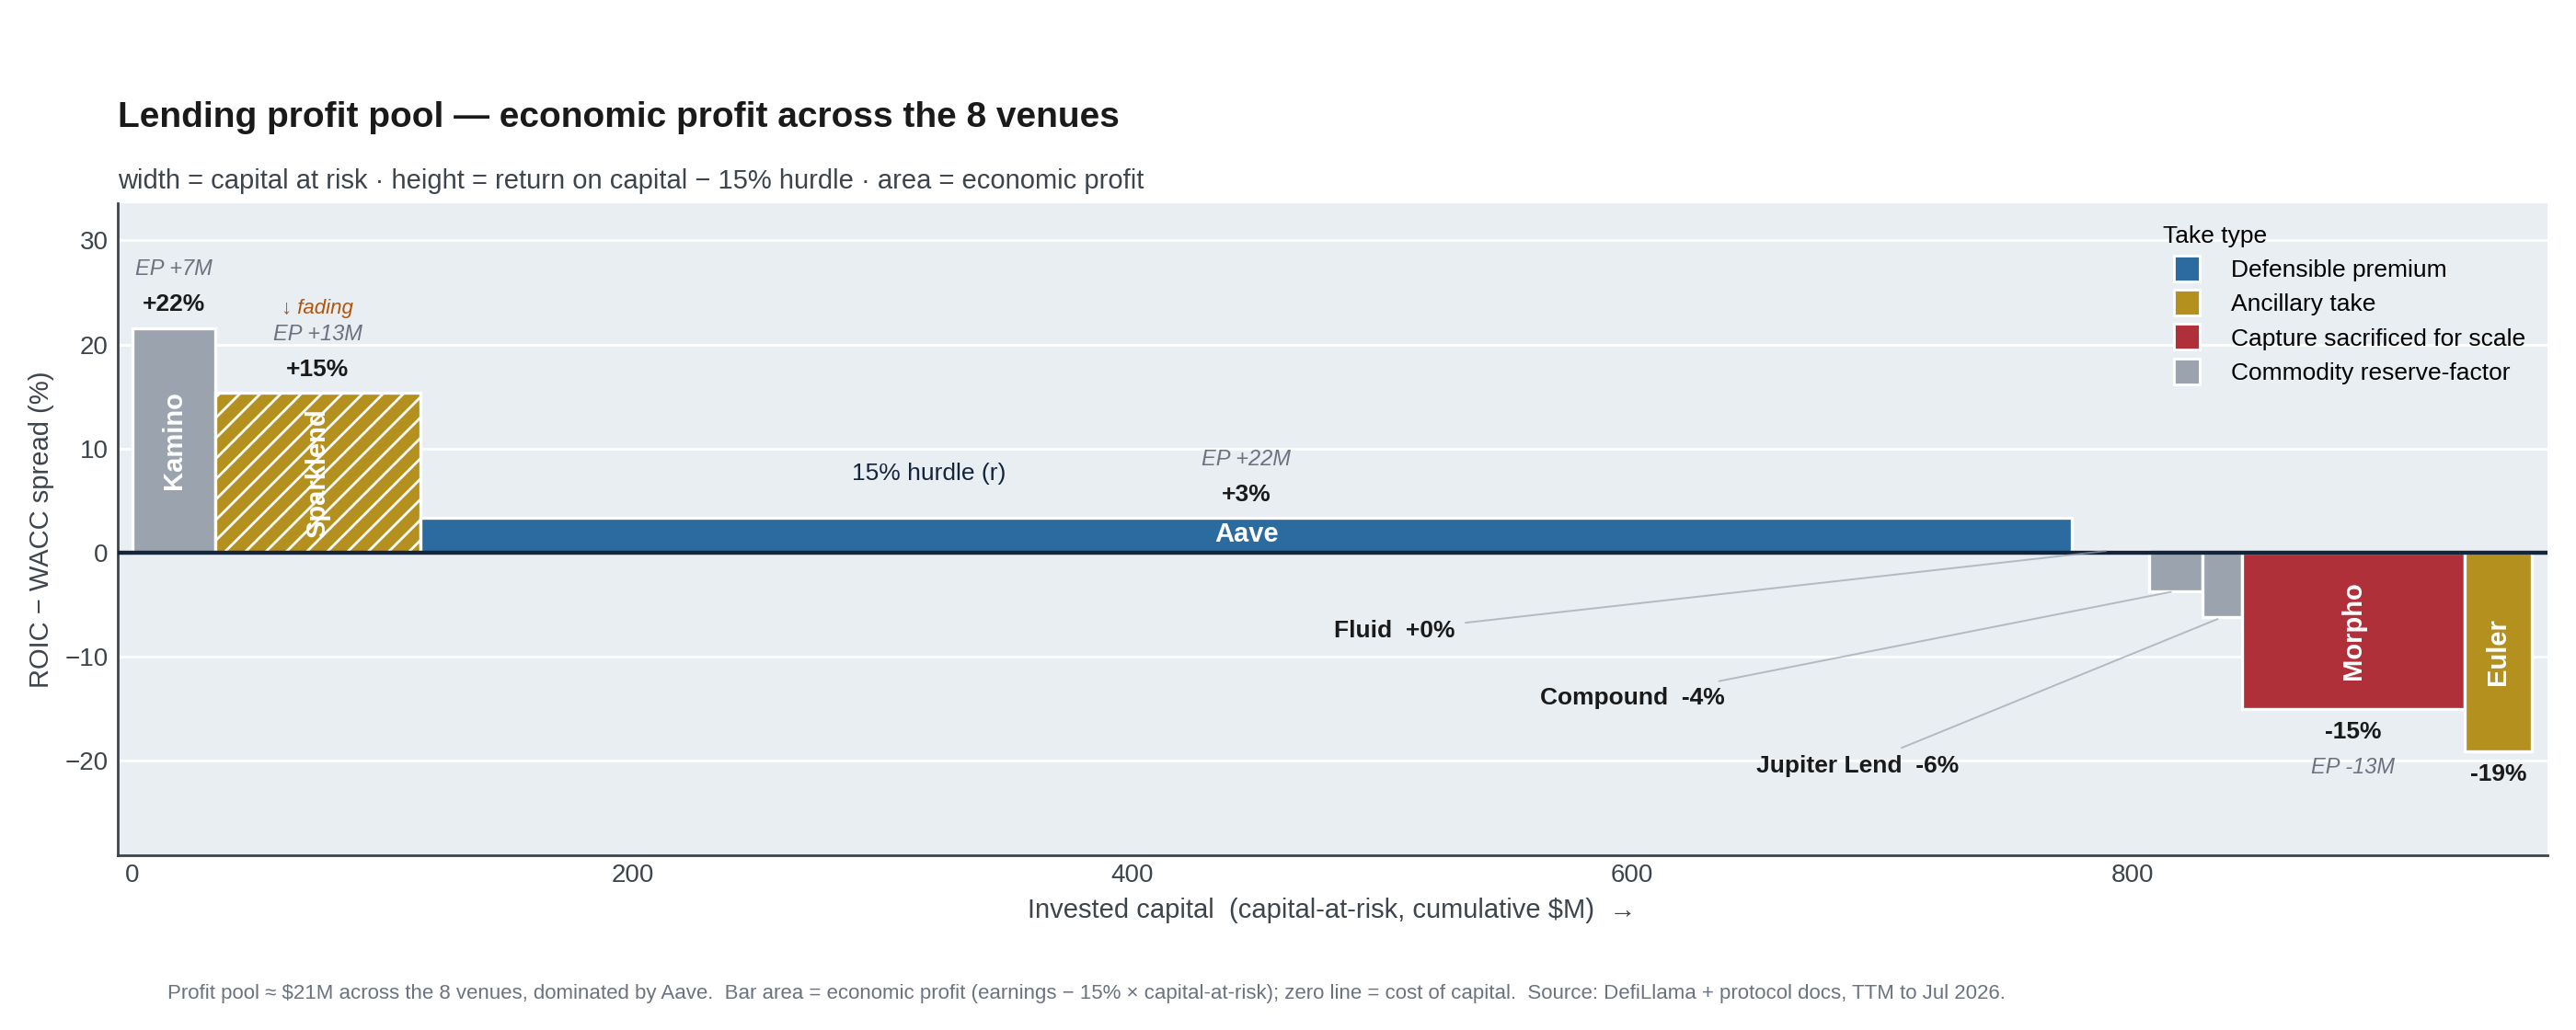
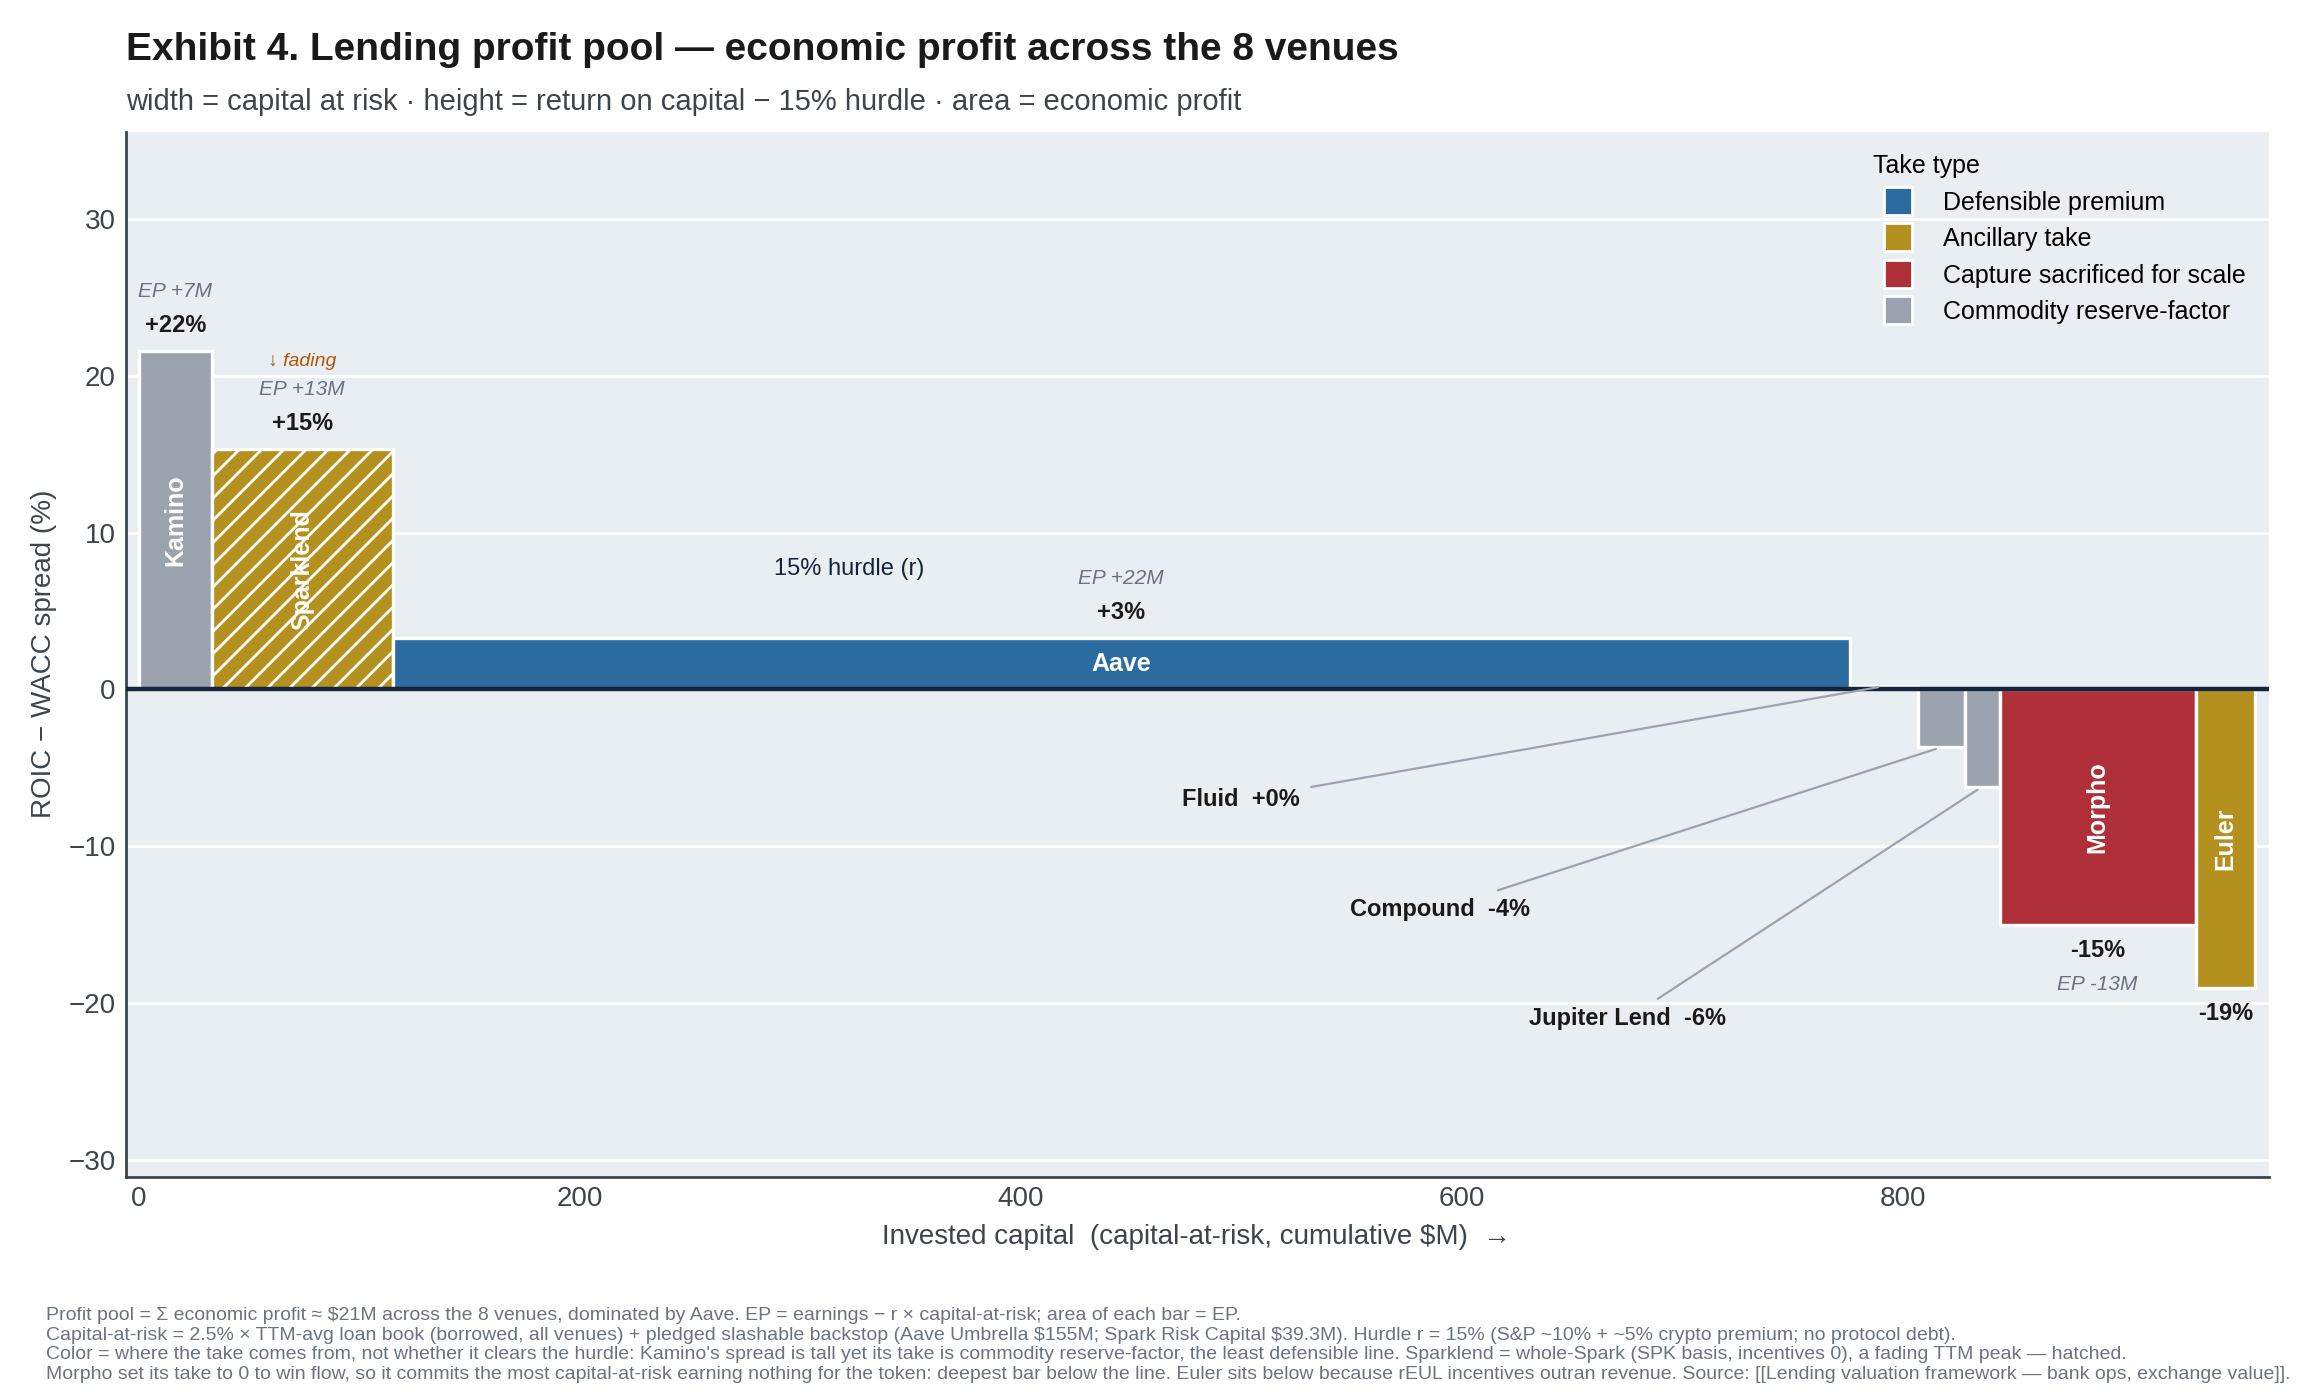
This relationship can be visualized as a profit pool. Each venue is a bar. Width is the capital at risk. Height is its return above the cost of that capital, or (ROIC) minus the Weighted Average Cost of Capital (WACC). And the area is the economic profit.
Source: DefiLlama
The flat line is the 15% hurdle (r). Above the line, projects are earning more than their cost of capital, and below the line, projects are earning less.
Aave holds the largest pool at +$22.5M, and once emissions are counted it carries the sector. It’s bar is short but by far the widest, so it holds the largest pool in absolute dollars.
Among the profitable venues, Kamino runs a high spread on a thin book, so it stands tallest and holds the third largest pool. SparkLend posted +$12.6M in economic profit, but it’s built on a fading peak with most of its earnings generated by the Spark Liquidity Layer (SLL), and not the loan book.
Fluid’s take clears the hurdle comfortably on a small balance sheet, but token incentives take almost all of it back. Before emissions it earns +$8.0M above the charge. However, it pays $7.9M in incentives, so net economic profit is +$0.1M, right at the line. Lending interest is 54% of its earnings. The other 46% comes from Fluid’s own DEX and Lite Vaults, which run on the same liquidity, and from a licensing cut it takes on Jupiter Lend’s book.
All other protocols, Compound, Jupiter Lend, Euler, and Morpho, are in economic deficits. Euler swings to −$5.2M once its rEUL emissions are counted, and Morpho is the deepest at −$30.3M.
Morpho is the only protocol that is deliberately operating beneath the hurdle. It earns nothing on real capital at risk and pays roughly $17M a year in token incentives on top, which is the price it pays to buy scale. Its planning to expand its bar, and eventually flip it above the line once it enables fee share, to become the largest profit pool. As a second order effect of Morpho’s zero-take, lenders will expect higher yields across the market which squeezes rivals’ reserve fees.
Valuing the market
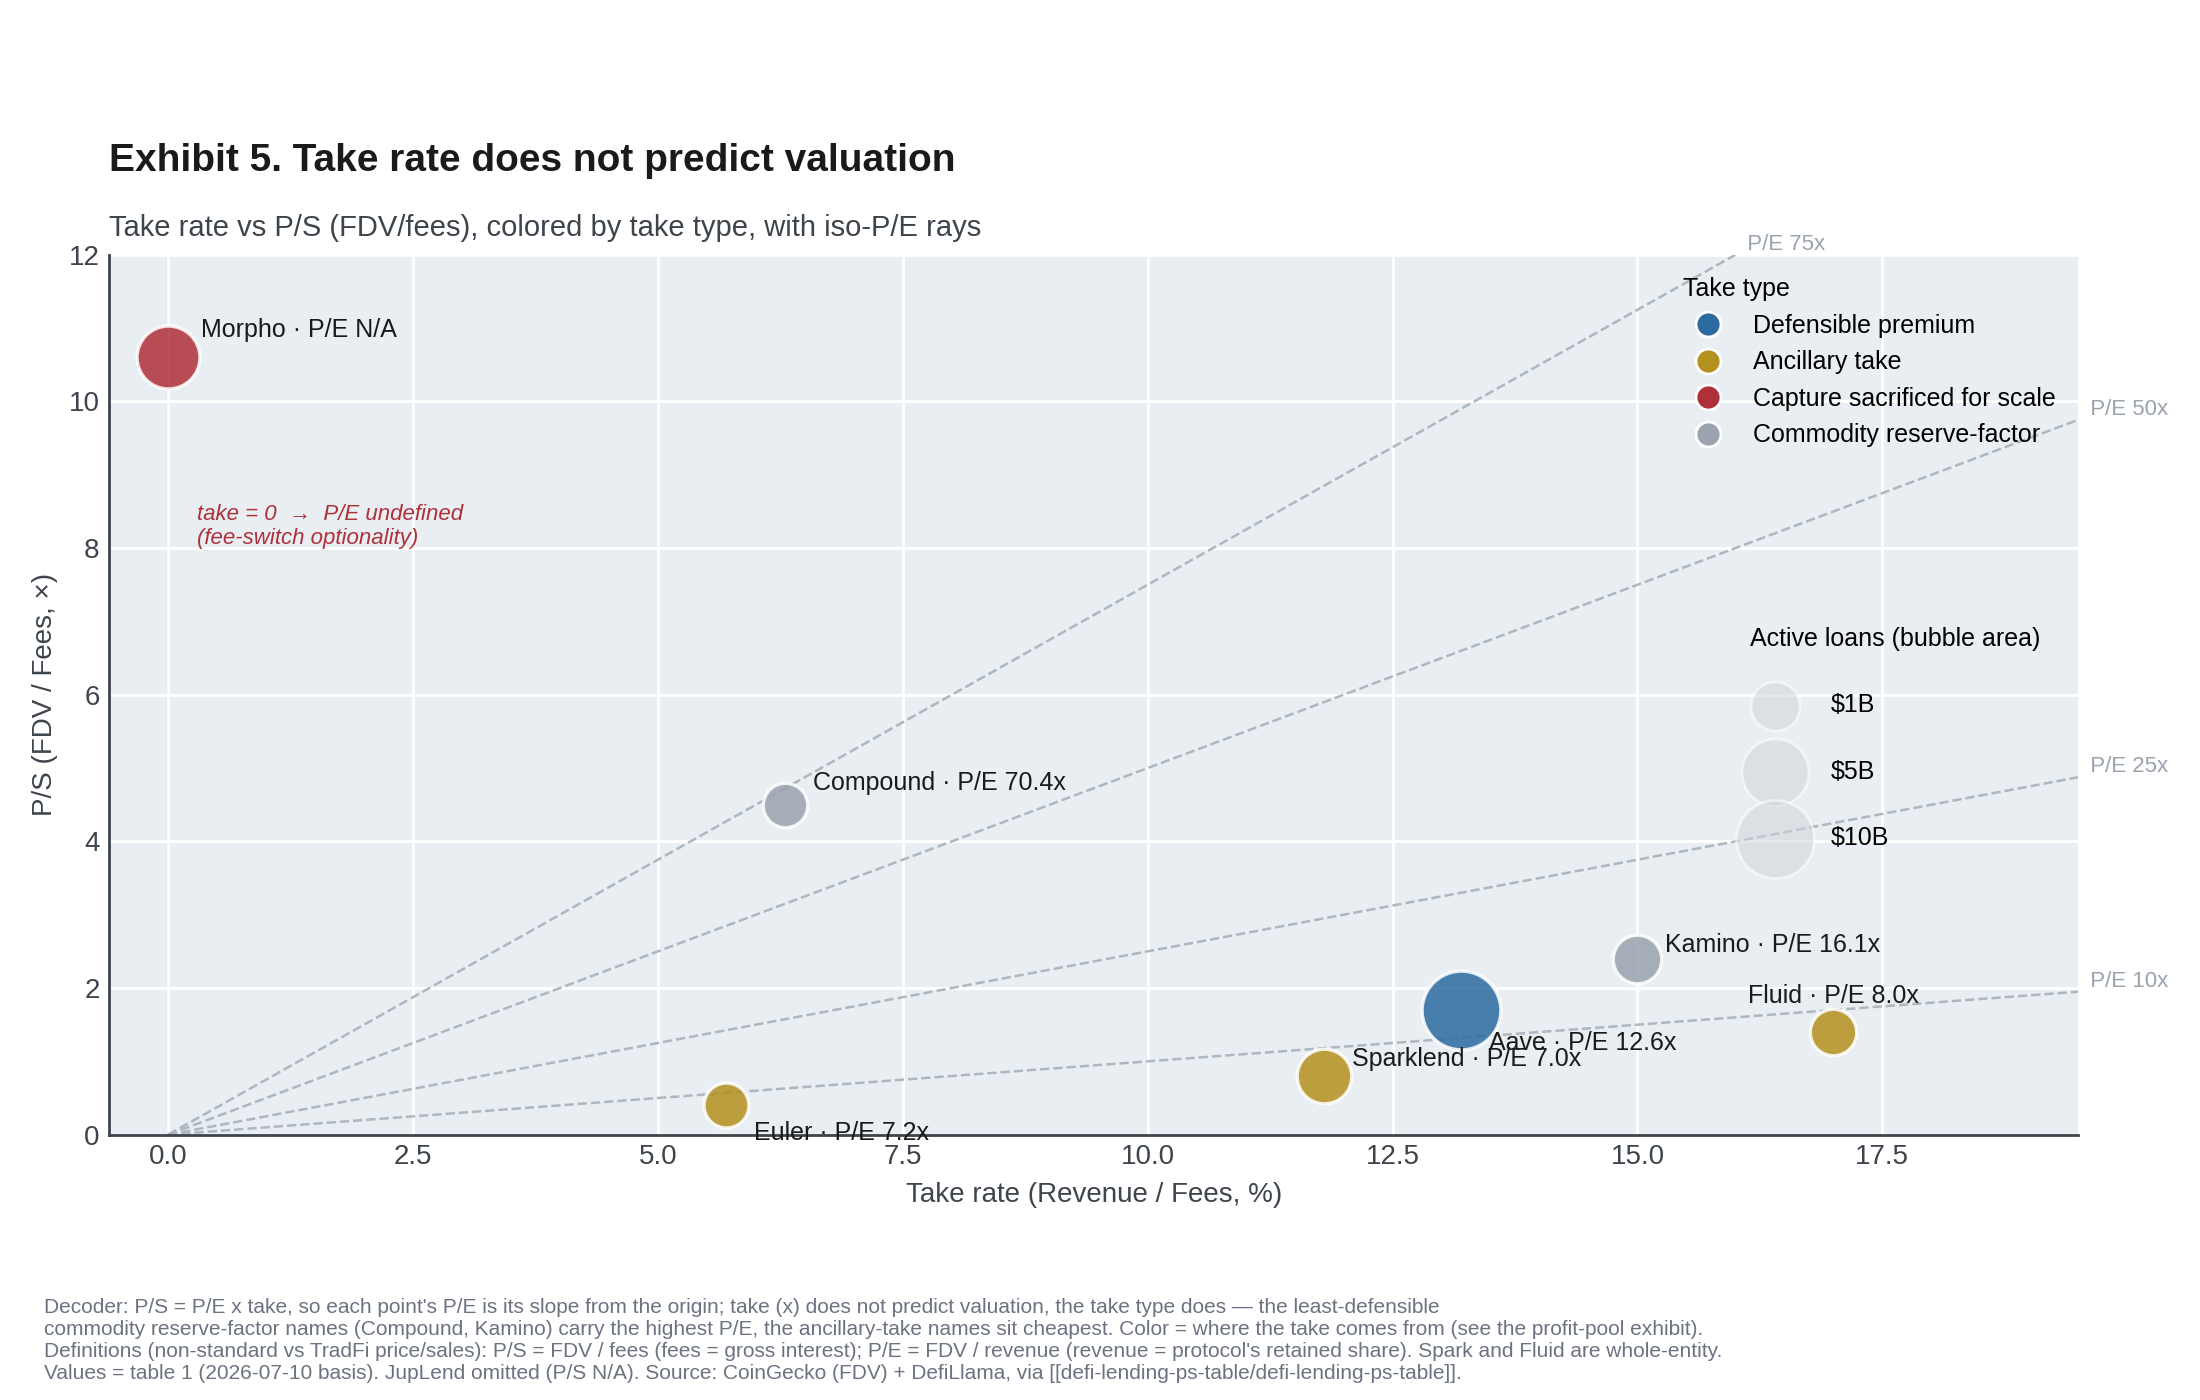
Valuations for the lending sector have a wide dispersion; 10x P/E-multiple spread ranging from SparkLend at 7.0x to Compound at 70.4x. To understand comps we separate P/E into two parts: P/S, the market’s value on gross revenue, and Take Rate, the protocol’s share of revenue.
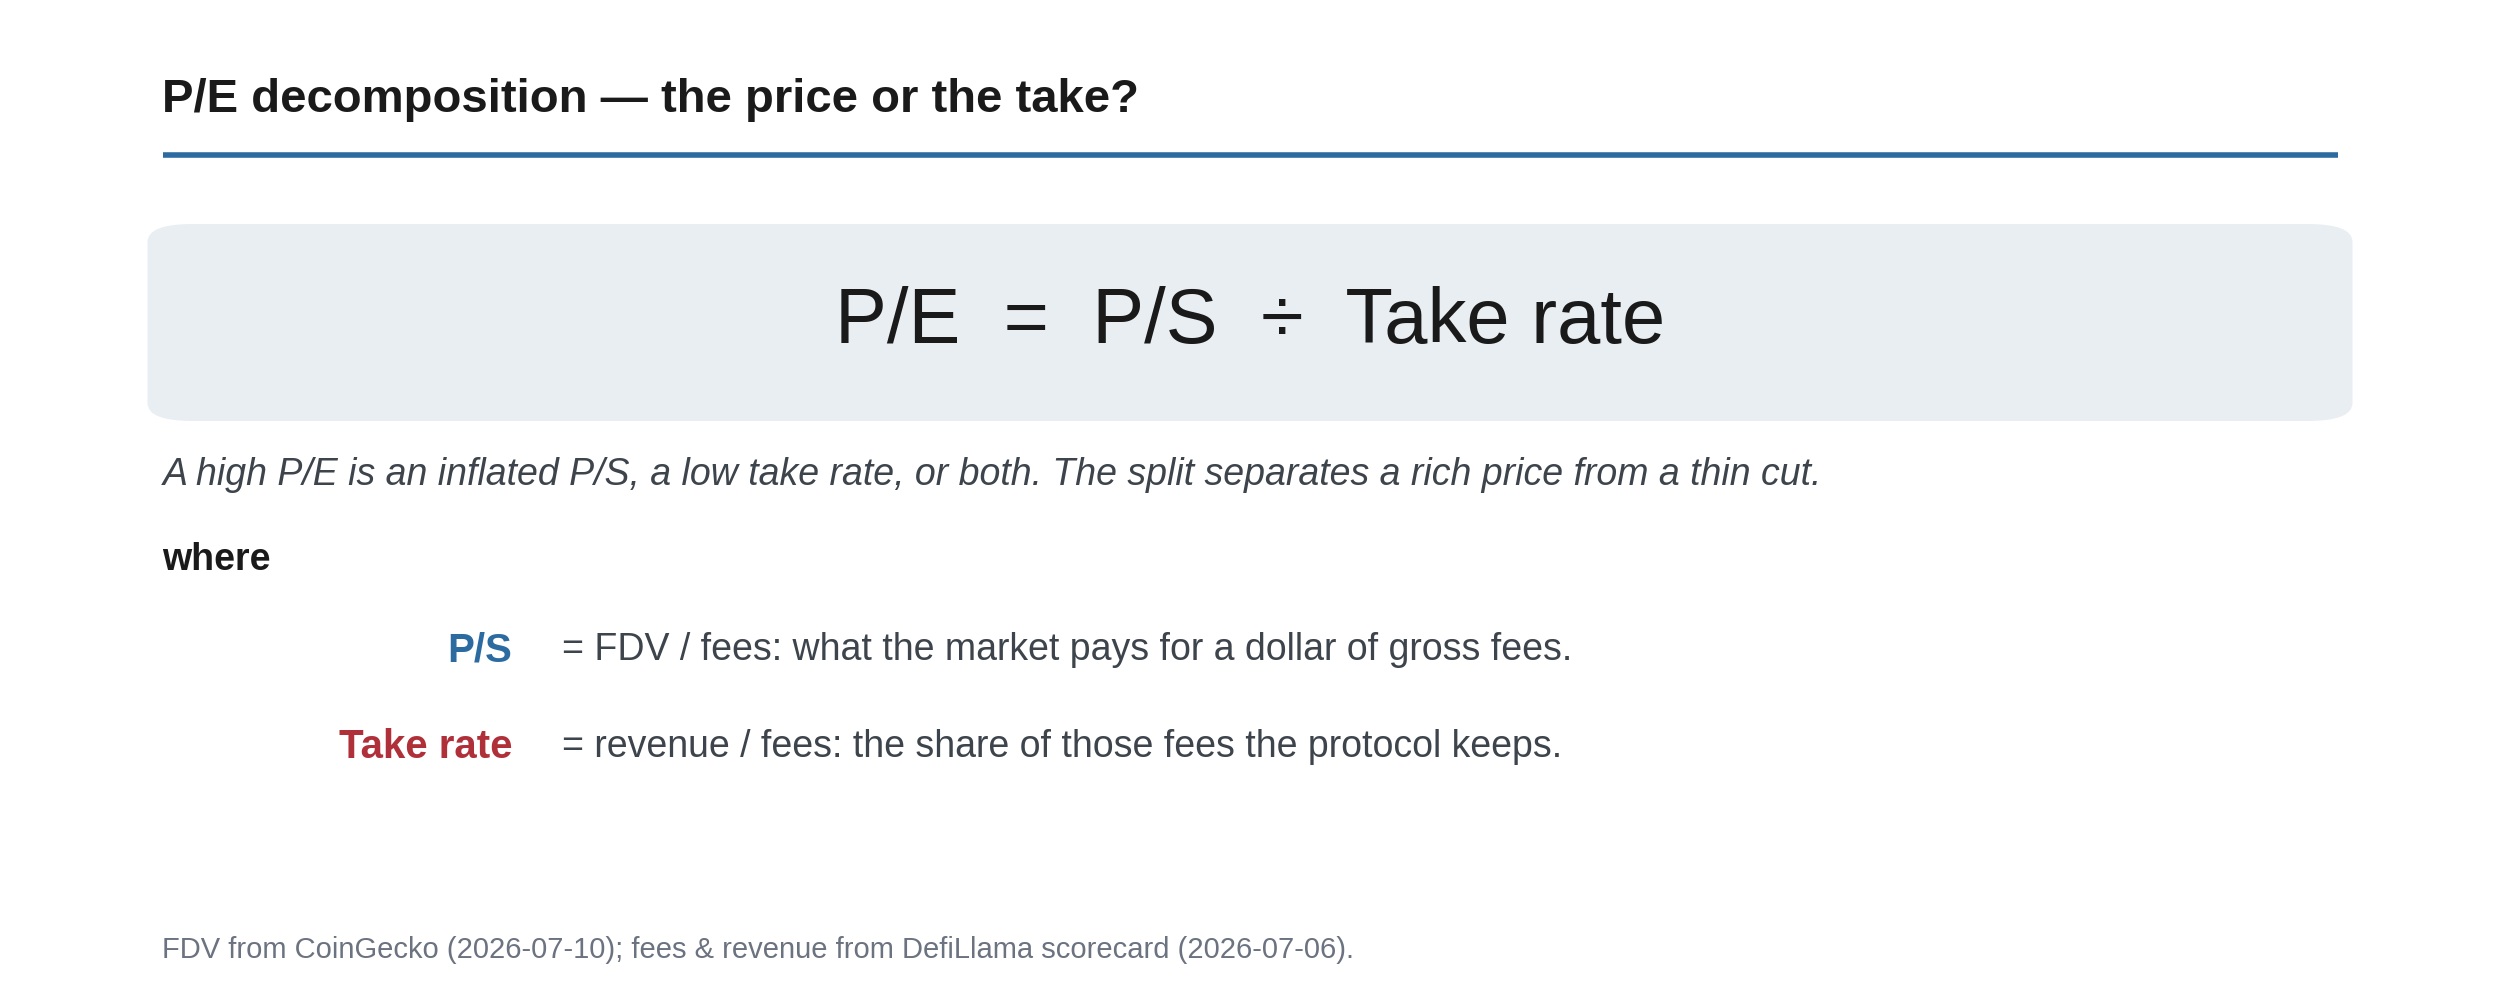
Since P/E = P/S ÷ Take Rate, a high P/E is either from an inflated P/S, a low take rate, or both.
| Protocol | Take rate (Earn / Rev) | P/S (FDV / Rev) | P/E (FDV / Earn) |
|---|---|---|---|
| Aave | 13.2% | 1.67x | 12.6x |
| Morpho | 0.0% | 10.57x | N/A |
| SparkLend* | 11.8% | 0.83x | 7.0x |
| Kamino | 15.0% | 2.42x | 16.1x |
| Jupiter Lend** | 5.3% | N/A | N/A |
| Fluid* | 17.0% | 1.36x | 8.0x |
| Euler | 5.7% | 0.41x | 7.2x |
| Compound | 6.3% | 4.46x | 70.4x |
* Whole-protocol endpoint for SparkLend and Fluid, as in the first table. ** Jupiter Lend has no P/S or P/E. Its FDV is the whole JUP token against lend-only fees, so the ratios are not comparable.
Source: DefiLlama + CoinGecko
As an example, Compound has a thin take rate of 6%, and a relatively high P/S of 4.5x, trading at 70.4x P/E (highest P/E multiple in the set). However, Compound’s loans decreased 47% over the last year, and earnings margin is among the lowest in the set (0.28%) suggesting that the market hasn’t repriced on its declining earnings yet. If take rate were to decline further (as the data suggests), Compound would shift to the left, placing it in the ~100x P/E range and making the current valuation increasingly difficult to justify.
Source: DefiLlama + CoinGecko
On the other hand, Euler also has a thin take rate of ~6%, but with a P/S of 0.4x it trades at 7.2x P/E. Both have similar take rates, but their P/E multiples are on opposite ends of the set. Compound with a low take and inflated P/S and Euler with a low take and depressed P/S.
Category-wide Catalysts
DeFi lending presently has a finite ceiling and is mostly a beta-to-crypto product. The biggest unlock comes from private credit and RWA collateral. Moreover, pending regulations can lift demand for the entire sector.
RWAs & Private Credit
RWA market cap sits at $31B with projections for $1–4T by 2030 (McKinsey, From ripples to waves, 2024).
With RWAs as collateral lending platforms stand to capture the $4T RWA opportunity. Equities, commodities, and private credit are already being used as collateral in DeFi. According to DefiLlama, ~$2.53B of RWAs are actively used in DeFi protocols.
Some notable examples include:
- Aave: Aave’s Horizon platform lists money market funds like Bitwise Crypto Carry Fund ($10.5M), and VanEck Treasury Fund ($6.3M) as collateral
- Kamino: Kamino offers markets for equities via xStocks ($30.4M), HELOCs via Figure ($437.3M), and Bitwise Crypto Carry Fund ($34.5M)
Similarly, Private credit collateral can help make loan books more exogenous. Products like Maple, OnRe, and USDai intermediate loans offchain and pool capital using tokenized structured products. When venues list these products as collateral, depositors can deposit and take out loans against these products.
However, this also increases risks of contagion and liquidation cascades that flow throughout multiple protocols.
Regulation
The GENIUS Act, signed in July 2025, already bars stablecoin issuers from paying yield to holders. The OCC’s 2026 rulemaking goes further and moves to extend that ban from the issuer to its affiliates and third parties, with the full regime operational in January 2027.
The CLARITY Act is the market-structure bill that provides some hope for DeFi. It moves to exempt non-custodial DeFi activity from SEC and CFTC authority, adding a DeFi trading-protocol framework and an insolvency safe harbor. It also carries the Tillis-Alsobrooks compromise which bars rewards that are economically or functionally equivalent to interest on a bank deposit. But it preserves a carve-out for incentives tied to “bona fide activities” or transactions, which brings sanctioned activities closer to credit-card rewards. As of July 2026 it has advanced out of the Senate Banking Committee on a 15-9 vote and awaits a floor debate. Interestingly, prediction markets price 2026 signing odds near 72%.
If non-custodial lending sits outside the yield prohibition, then DeFi lending becomes the one compliant venue left where a dollar earns a yield that banks and CeFi are prohibited from paying. That would make lending platforms the primary venue for retail and third-party integrations to source stablecoin yield.
However, if the prohibition extends to the lending protocols themselves, the loophole closes.
Closing Thoughts
Scale is the only lever left, but liquidity is the scarce input that scale is built from which places a spotlight on issuers like Sky.
Sky is the clearest example as it sets the savings rate it pays to hold USDS, and it also sets the base rate it charges to lend it. Since it controls both legs it can administer spread that stays relatively steady. So the durable position in the lending wars may not be a lender after all, and instead it may be the stablecoin franchise that supplies the liquidity.
Aave understands this, and is using GHO to move from renting the dollar to issuing it. But GHO still runs a roughly $18M deficit, and its growth depends on Aave’s own loan demand, which is crypto-native and cyclical. Aave starts from lending and builds a dollar on top of that. Sky starts at the opposite end, from the dollar and builds lending on top of it with Spark. Essentially, Sky’s bet is the easier one, which could leave it better positioned even though Aave is better known.
While lending venues compete, the larger position is on who owns the dollar and who owns the user. Those two fights get settled on lending venues as the battlegrounds.
Publication note: Originally published July 14, 2026. Updated August 25, 2026 to separate the AAVE/MORPHO thesis into a standalone report.
Disclosure: This report is independent research provided for informational purposes. Any material commercial relationship with an entity discussed will be disclosed.